


Movavi Screen Recorder 21 – 1 year subscription
June 7, 2018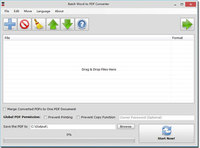
Batch WORD to PDF Converter PRO
July 3, 2018
LINQ Insight
LINQ Insight is a Visual Studio add-in that allows you to execute LINQ queries at design time right from your code and profile ORM calls and thus greatly simplifies LINQ debugging.
Download Trial
€ 112.80
LINQ Insight is a Visual Studio add-in that allows to execute LINQ queries at design-time directly from Visual Studio without starting a debug session, allowing you to test queries instantly after you write them. LINQ Insight also provides a powerful ORM Profiler tool for profiling the data access layer of your projects and tracking all the ORM calls and database queries from the ORM. LINQ Insight integrates into Visual Studio 2010, 2012, 2013, 2015, 2017 and 2019. Entity Framework 6 is now supported in the latest version of the product.
Key features:
- Design-time LINQ Query Execution. Unlike different LINQ debug visualizers, LINQ Insight does not require you to start debugging and step to the LINQ query execution for viewing returned data and generated SQL. LINQ Insight allows you to test LINQ queries at design-time. Just execute LINQ queries right from Visual Studio editor and view the result without leaving the IDE. Test your LINQ queries instantly after you write them. LINQ Insight detects the used context and connection string automatically. LINQ Insight displays the returned data in a powerful grid with advanced data grouping, sorting and filtering. LINQ Insight supports both usual LINQ queries and queries through extension methods and can work with anonymous queries, for example, with immediate ToList calls.
- ORM Profiler. LINQ Insight offers true ORM profiler. It allows you to really profile application interaction with ORM runtime. With LINQ Profiler tool you can see how much time LINQ statement or SubmitChanges call takes to execute as a whole even if it generated multiple SQL statements. You profile exactly the code you write and study the real performance of your LINQ code. To start profiling a project you just need to open the LINQ profiler window, click the Start profiler session button on its toolbar. Then run the project and real-time data on ORM events.
You must be logged in to post a review.
Related products
-
dbForge Data Pump for SQL Server
€ 112.80Data Pump is a SQL Server Management Studio add-in for filling SQL databases with external source data and migrating data between systems. The tool supports import and export from 10+ widely used data formats (Excel, CSV, XML, JSON, Text, MS Access, etc.) and includes a number of advanced options and templates for recurring scenarios.
Download Trial -
dbForge Data Compare for SQL Server
€ 263.24dbForge Data Compare for SQL Server is a powerful easy-to-use SQL compare tool.
Download Trial -
dbForge Data Compare for Oracle
€ 150.41dbForge Data Compare for Oracle is a powerful, fast, and easy-to-use tool for Oracle database comparison and synchronization
Download Trial


Reviews
There are no reviews yet.